Dumbbell Dot

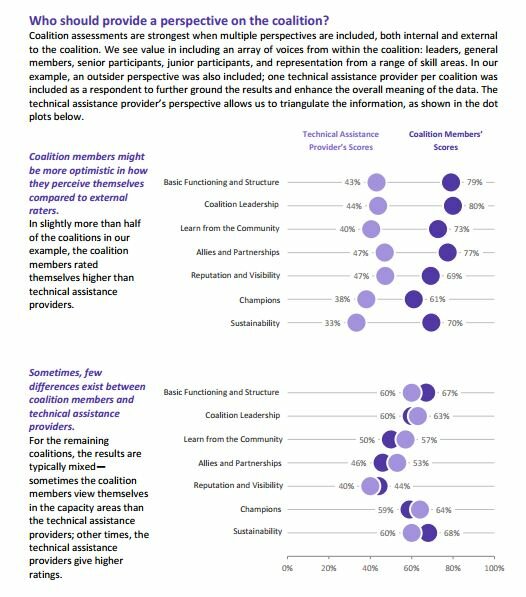
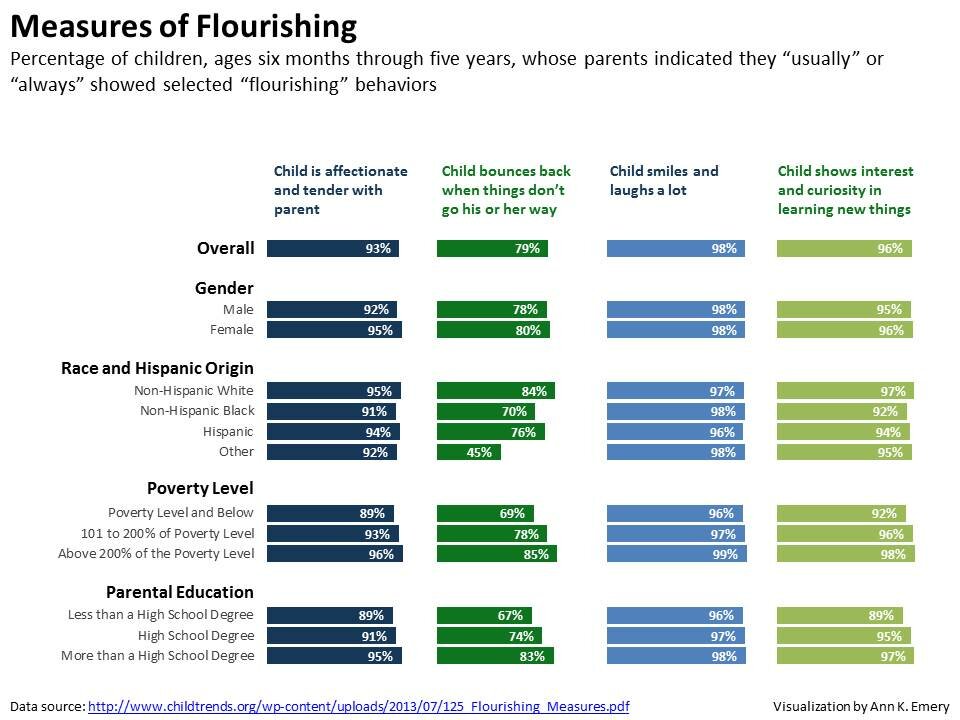
Dumbbell dot plots — dot plots with two or more series of data — are an alternative to the clustered bar chart or slope graph. Examples: Young people are less likely to vote: https://twitter.com/pewglobal/status/545589549788045312 Catholics vs. Protestants: https://twitter.com/pewresearch/status/532886903641473028 Pessimistic outlooks by country: http://www.pewresearch.org/fact-tank/2014/11/12/unrest-in-the-middle-east-taking-a-toll-on-peoples-outlooks/

Continue reading →

Dot

Continue reading →

Small Multiples Bar

The small multiples bar chart — disaggregating at its finest. Tutorial: http://www.annkemery.com/data-table-to-small-multiples/

Continue reading →

Back-to-Back Bar

Examples: Immigrants Eligible and Ineligible for Relief Under Obama Programs: http://www.pewresearch.org/fact-tank/2014/12/01/who-are-the-unauthorized-immigrants-ineligible-for-obamas-executive-action/ http://www.economist.com/news/21631911-end-population-pyramid-world-reshaped Japan’s working-age population of males and females: http://www.pewresearch.org/fact-tank/2014/11/25/6-facts-about-japans-downbeat-economy

Continue reading →

Side-by-Side Bar

Continue reading →

Clustered Bar

Continue reading →

Bar

Continue reading →

Page 6 of 15 ← First ... 4 5 6 7 8 ... Last →

Related Links:

Togel178

Pedetogel

Sabatoto

Togel279

Togel158

Colok178

Novaslot88

Lain-Lain

Partner Links