How to Transform Your Slideshow’s Bullet Points into Images

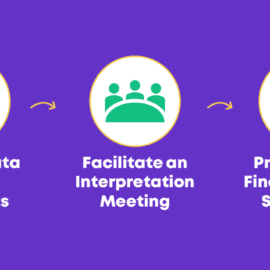
How to Transform Your Slideshow’s Bullet Points into Images

A few weeks ago, I showed you how to transform allllllllll of your presentation’s information into just a few main chunks. You can visually chunk information by creating divider slides and by using consistent colors and icons: The previous post focused on divider slides. This…

Continue reading →

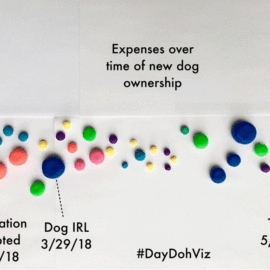
#DayDohViz: Play-Doh as a Tool for Data Visualization

#DayDohViz: Play-Doh as a Tool for Data Visualization

I often write about practical software how-tos. But at my core, I’m software-agnostic. I don’t care which software program you choose. I’ve seen stellar visualizations in good ol’ Excel and downright embarrassing visualizations in fancier software programs whose salespeople pretend that their software is a…

Continue reading →

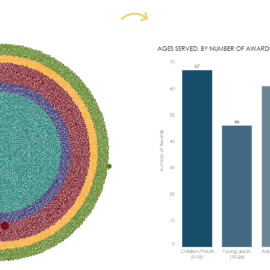
Seven Tips for Formatting Tableau Dashboards: What We’ve Learned from Designing Dashboards at NASAA

Seven Tips for Formatting Tableau Dashboards: What We’ve Learned from Designing Dashboards at NASAA

I met Patricia Mullaney-Loss this spring and was excited to hear how Patricia and her colleagues are thinking carefully about the dashboards they design for their end users. Today, Patricia is sharing her top seven tips for designing visualizations in Tableau. Enjoy! –Ann Tableau dashboard…

Continue reading →

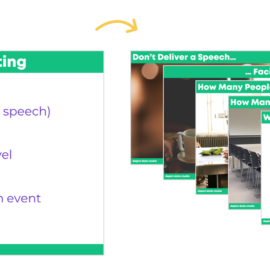
How to Visually Structure Your Presentation Around Key Points

How to Visually Structure Your Presentation Around Key Points

There’s nothing worse than presentations that drone on without a clear message. You know the feeling: You’re sitting in the audience at a conference. The speaker goes on and on. And on. And on. Later, someone asks what you learned from the presentation. You remember…

Continue reading →

How to Objectively Measure Text Readability (and Lower Your Graph’s Reading Level)

How to Objectively Measure Text Readability (and Lower Your Graph’s Reading Level)

If viewers can’t read your graph, why bother making it? Accessibility is at the top of my priority list. A lot of things go into a data visualization’s readability, including: the graph type you select (3D exploding pie charts with 999 slices are inherently hard…

Continue reading →

Page 1 of 38 1 2 3 4 5 ... Last →

Related Links:

Togel178

Pedetogel

Sabatoto

Togel279

Togel158

Colok178

Novaslot88

Lain-Lain

Partner Links