Tag archive for Nonprofit Organizations

Transforming a Table: Four Charts and Four Different Stories

Transforming a Table: Four Charts and Four Different Stories

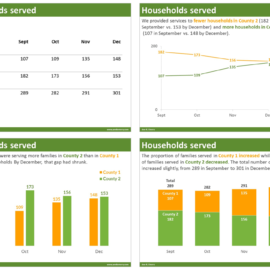
A few weeks ago I gave the keynote speech at the Alabama Power Foundation’s Elevate conference for several hundred of their grantees and partners. What a day! As part of the most-practical-keynote-you’ve-ever-heard emphasis, we included makeovers from the grantees’ real projects. In case it’s useful…

Continue reading →

Pie Chart Makeover: Revenue and Expenses

Pie Chart Makeover: Revenue and Expenses

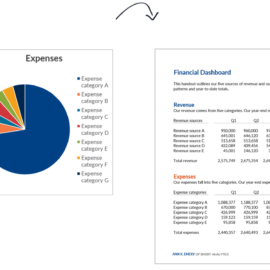
A couple weeks ago I was in Birmingham with the Alabama Power Company’s grantees. We spent two days learning data visualization principles and producing makeovers of their graphs. Before One of the grantees was presenting their revenue and expenses data like this, in two pie…

Continue reading →

Pie Chart Makeover: Quarterly Breakouts by Gender

Pie Chart Makeover: Quarterly Breakouts by Gender

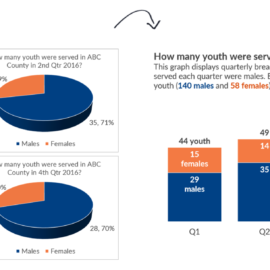
A few weeks ago I was in Indianapolis with the juvenile detention alternatives initiative. This group wanted to graph: how many youth went to juvenile detention centers, by gender, and by quarter. Brainstorming There are a dozen ways to graph each dataset. For this data,…

Continue reading →

Related Links:

Togel178

Pedetogel

Sabatoto

Togel279

Togel158

Colok178

Novaslot88

Lain-Lain

Partner Links