Dumbbell Dot
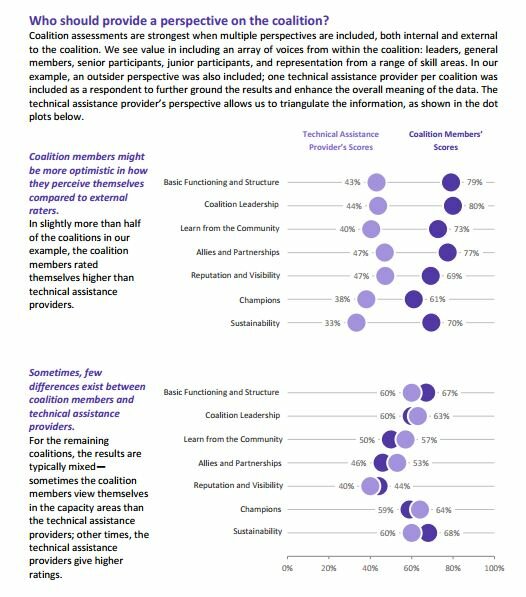
Dumbbell dot plots — dot plots with two or more series of data — are an alternative to the clustered bar chart or slope graph. Use dot plots to visualize two or three different points in time. Or, use them to triangulate different viewpoints (e.g., one dot for Republicans and another dot for Democrats, or one dot for principals and another dot for teachers).
Synonyms
Resources
Dot plots to compare subgroups
- Diets in urban areas more diverse compared to rural
- India is predominantly non-vegetarian: Men vs. women
- Pregnant women eat healthier diets across all wealth classes
- Estimated cost of Senate and House tax plans
- Wages of all occupations by education
- Marketplace plans in Boise, ID
- Trust in climate scientists is low among Republicans; considerably higher among liberal Democrats
- More concern about violence, teenage pregnancy among lower-income parents
- Language that describes male vs. female professors
- Number of job postings vs. hires in various industries
- Viewpoints on China, Millenials vs. Age 50+
- Republican vs. Democrat support for marijuana by age group
- Young people are less likely to vote
- Catholics vs. Protestants
- Pessimistic outlooks by country
Dot plots to show change over time
- Where the 1 percent have gained the most
- Trump’s most likely nominee for Fed chair
- How much could the championship table change?
- Apartment prices in 2005 vs. 2015
Template
Purchase the templates ($5)
Agen Togel Resmi dengan Hadiah 4D 10 Juta di Tahun 2024
Kumpulan agen togel terbaik dengan hadiah-hadiah terbesar yang jarang anda temukan. kami menyediakan permainan togel online yang memiliki hadiah 4D Terbesar di tahun 2024, dimana anda kan merasakan hadiah 4d 10 juta. bagi anda pemain togel jangan ragu karena Situs Togel ini sudah resmi terpercaya dengan pembayaran yang super cepat dan pastinya aman. selain itu situs ini juga memberikan bocoran bocoran angka keluar yang akan membantu anda mendapatkan hadiah terbesar yang kami sediakan. daftar sekarang juga dan rasakan kemenangan yang menakjubkan.
Togel resmi ini menawarkan pengalaman bermain togel online yang luar biasa. Dengan antarmuka yang mudah digunakan, sistem transaksi yang aman, dan dukungan pelanggan yang responsif, Situs Togel Terpercaya ini menjadi pilihan terbaik. para pemain togel dapat menikmati berbagai permainan seperti togel 4D, 3D, dan 2D dengan peluang menang yang besar.
BO Togel dengan deposit minim mulai 10 ribu menjadi pilihan populer di kalangan pecinta togel yang ingin merasakan pengalaman bermain tanpa mengeluarkan modal besar. Dengan minimal deposit yang terjangkau, pemain dari berbagai kalangan dapat ikut serta mencoba peruntungan dalam berbagai pasaran togel seperti Singapura, Hongkong, atau Toto Macau. Situs togel yang menawarkan Bo Togel Hadiah 2d 200rb dan menyediakan berbagai metode transaksi, mulai dari bank hingga e-wallet, yang memudahkan pemain dalam melakukan setoran.
Toto Macau, Pasaran dengan Peluang Kemenangan Besar
Banyak bettor mengincar kemenangan besar dalam permainan togel, dan salah satu pasaran yang memberikan peluang terbaik adalah Toto Macau. Dengan sistem pengundian yang dilakukan secara adil dan terbuka, pemain merasa lebih nyaman dalam memasang taruhan mereka. Selain itu, Toto Macau memiliki berbagai metode transaksi yang memudahkan pemain dalam melakukan deposit dan withdraw.
Ketika mencari tempat untuk memasang taruhan togel online, tentu ada banyak faktor yang perlu dipertimbangkan, mulai dari keamanan, variasi permainan, hingga bonus yang ditawarkan. Situs Toto menjadi pilihan unggulan karena menyediakan berbagai pasaran terlengkap dengan peluang kemenangan yang lebih besar. Selain itu, layanan pelanggan yang responsif memastikan setiap pemain mendapatkan pengalaman terbaik saat bermain.
Cara Bermain Slot Gacor dengan Peluang Menang Tinggi
Strategi dalam bermain slot gacor juga memainkan peran penting. Mulailah dengan menetapkan taruahan yang jelas untuk permainan Anda dan patuhi itu. Manfaatkan bonus dan promosi yang kami sedikan, seperti free spins atau bonus deposit, untuk memperpanjang waktu bermain Anda. Slot Gacor Ini tidak hanya memberi Anda lebih banyak peluang untuk menang tetapi juga membuat pengalaman bermain lebih menyenangkan. selain itu penting untuk memahami mekanisme dasar dari setiap slot yang Anda mainkan.
Rahasia scatter hitam di Mahjong Ways terletak pada kesabarannya. Slot ini sering kali memberikan kejutan besar bagi mereka yang tetap konsisten dalam bermain. Mahjong Slot adalah kunci untuk membuka peluang free spin dan pengganda besar, sehingga penting untuk terus memainkannya dengan taruhan yang bijak. Menggunakan bonus deposit atau free spin dari situs slot dapat menjadi cara cerdas untuk meningkatkan peluang Anda di tahun 2024.
Slot 5rb telah menjadi favorit banyak pemain karena memberikan akses mudah dengan modal rendah. Meskipun nominal depositnya kecil, peluang untuk mendapatkan jackpot dan bonus tetap besar di Slot Deposit 5k, apalagi jika pemain bermain di situs dengan RTP tinggi.
Dapatkan Peluang Menang Besar dengan RTP Live Slot Gacor
Ketika berbicara tentang RTP slot gacor tertinggi, tidak hanya soal persentase kemenangan, tetapi juga seberapa konsisten mesin tersebut memberikan pengembalian. RTP slot gacor mengacu pada mesin yang sering memberikan kemenangan dengan RTP tinggi. Pemain selalu mencari tahu update terbaru mengenai slot RTP tertinggi agar bisa mendapatkan keuntungan lebih.
Jika Anda sedang mencari permainan slot online dengan peluang menang tinggi, maka Toto Slot bisa menjadi pilihan yang tepat. Dengan banyaknya variasi permainan yang tersedia, pemain memiliki kebebasan untuk memilih slot yang sesuai dengan gaya bermain mereka. Selain itu, Toto Slot juga dikenal karena tingkat RTP yang tinggi, sehingga memberikan kesempatan lebih besar untuk mendapatkan keuntungan dalam jangka panjang.
Salah satu hal yang sering menjadi perhatian para pemain adalah kejujuran dalam permainan. Slot777 menerapkan sistem fair play yang memastikan bahwa setiap hasil permainan benar-benar acak dan tidak bisa dimanipulasi. Dengan menggunakan teknologi RNG (Random Number Generator), platform ini memberikan jaminan bahwa semua pemain memiliki peluang yang sama untuk menang.
Related Links:
Togel178
Pedetogel
Sabatoto
Togel279
Togel158
Colok178
Novaslot88
Lain-Lain
Partner Links
- Pemain togel pasti Sabatoto tahu togel Hong Kong, yang disebut juga website besar itu.
- Sekarang Anda dapat bermain togel bersama teman tanpa potongan melalui situs deposit Sabatoto Dana.
- Toto Macau www.resea-rchgate.net mengeluarkan hasil 4 kali sehari, memungkinkan pemain bermain kapan saja.
- Dengan memanfaatkan Sabatoto prediksi kami, peluangmu mendapatkan JP paus semakin besar.
- Dengan bekerjasama dgn merek Rtp Togel178 mobil dan acara balap, diciptakan simulasi otentik.
- Anda hanya perlu unduh dan pasang situs togel terpercaya aplikasi itu, masuk via browser, cari kata, klik link.
- Apakah Anda suka www.thedispensarypub.com judi esport.
- Cek apakah menerima kartu Togel 279 kredit, transfer bank, atau e-wallet untuk pembayaran.
- Tiap pemain aman dengan situs BO deposit Togel158 QR yang terpercaya.
- Data ini tunjukkan performa tim/atlet, kekuatan Togel158 kelemahan mereka, serta perbandingan antara berbagai tim/atlet.
- Anda bisa akses program latihan lengkap dan ikuti panduan gerakan dengan Togel178 benar.
- Mengetahui https://macauindo.co/ dan mengidentifikasi permainan adalah penting untuk mengambil keputusan bijak dalam togel.
- Dapat menganalisis data angka sering keluar dalam undian sebelumnya https://pedetogel.net/ bisa membantu.
- Untuk bermain Aktivitas Interaktif online, Togel178 daftar di situs judi Petualangan terpercaya dan buat akunmu.
- Dari penurunan harga hingga uang kembali, dealer terpercaya menawarkan bonus kasino situs togel279 langsung yang bervariasi.
- Anda dapat melakukan deposit di agen Aktivitas Interaktif terpercaya dengan Togel178 berbagai metode yang disediakan.
- Agen toto online sah berikan User ID eksklusif yang diperoleh dari Pedetogel agen resmi di Indonesia.
- Metode alternatif untuk masuk dengan cepat di https://www.recycledmanspeaks.com/videos situs resmi agen Game online.
- Jika mengeluarkan uang secara sembarangan tanpa kontrol, www.saintjohnsbrooklyn.com Anda bisa rugi di judi bola online.
- Pastikan main di situs Olahraga situs togel daring yang terpercaya dan terjamin legitimasinya.
- Dengan mempelajari cara main Aktivitas Interaktif Togel158 online dan menerapkan strategi tepat, Anda bisa menang lebih.
- Dengan judi Keseruan online, Anda bisa merasakan sensasi taruhan sama seperti Togel178 di kasino, namun dari
- Anda https://kampuspoker.com/ akan menerima saran bagaimana mengelola saldo taruhan secara cerdas.
- Dengan cara ini, Anda bisa memulai permainan Olahraga online dengan Slot menyenangkan dan menguntungkan.
- Karena itu, tidak lagi rahasia bahwa sekarang masuk daftar poker online ke situs 1 - daring - dalam talian - maya - digital terbaik.
- Keamanan dan kenyamanan kunci di dunia Colok178 Mainan.
- Mencari situs yang menyediakan berbagai permainan menarik serta peluang kemenangan tinggi bukanlah hal yang mudah. Namun, Pedetogel hadir sebagai solusi bagi mereka yang ingin mendapatkan pengalaman bermain yang menyenangkan serta menguntungkan.
- Bermain togel kini semakin praktis dan menguntungkan dengan hadirnya Pedetogel yang memberikan berbagai kemudahan bagi para pemainnya. Dengan layanan pelanggan yang siap membantu selama 24 jam, Anda tidak perlu khawatir mengalami kendala saat bermain. Situs ini juga menawarkan berbagai promo menarik yang bisa dimanfaatkan untuk menambah peluang kemenangan.
- Jika Anda menginginkan pengalaman bermain togel yang lancar tanpa hambatan, memilih platform yang tepat adalah kunci utama. Pedetogel hadir sebagai solusi bagi para penggemar togel yang ingin menikmati taruhan dengan peluang menang tinggi serta berbagai bonus menarik setiap harinya.
- Banyak orang kini memilih situs macau karena reputasinya yang telah terbukti dalam memberikan layanan terbaik bagi para pemain. Dengan berbagai pilihan permainan yang tersedia, situs ini memberikan kenyamanan serta pengalaman bermain yang luar biasa. Fasilitas transaksi yang cepat dan aman juga menjadi alasan mengapa banyak orang beralih ke situs ini.
- Bermain togel bukan sekadar menebak angka, tetapi juga soal kepercayaan terhadap platform yang digunakan. Memilih situs togel resmi adalah langkah penting agar pemain mendapatkan pengalaman terbaik tanpa kendala. Selain menyediakan berbagai metode transaksi yang cepat, platform ini juga menawarkan diskon taruhan yang menguntungkan. Keamanan data pengguna selalu menjadi prioritas utama agar para bettor merasa nyaman setiap kali melakukan pemasangan angka keberuntungan mereka.
- Banyak pemain baru mencari platform yang mudah digunakan dan terpercaya. Ketika berbicara tentang rekomendasi terbaik, nama Toto92 sering kali muncul karena reputasinya yang sudah teruji. Tak heran jika jumlah pengguna terus meningkat setiap harinya.
- Banyak pemain game online mencari tempat yang tidak hanya aman tapi juga memberikan keuntungan nyata. Itulah sebabnya Toto92 menjadi sorotan di antara komunitas pecinta judi digital. Dengan berbagai pasaran yang tersedia dan kemudahan dalam bertransaksi, pengguna bisa bermain tanpa hambatan. Didukung teknologi mutakhir dan sistem anti-bot, kenyamanan dan keadilan bermain di situs ini benar-benar terjamin.
- Banyak pemain yang memilih Togel279 karena keandalan dan kualitas layanan yang ditawarkannya. Dengan sistem yang terjamin keamanannya, platform ini memastikan pengalaman bermain yang lebih nyaman dan bebas dari kekhawatiran, memberikan nilai lebih bagi penggunanya.
- Era digital telah membawa berbagai kemudahan dalam kehidupan sehari-hari, termasuk dalam hal menikmati hiburan berbasis daring. Di antara banyaknya pilihan yang tersedia, Togel178 muncul sebagai salah satu opsi yang mulai mendapat perhatian karena kemudahan akses dan tampilan antarmuka yang ramah pengguna. Kelebihan lainnya adalah ketersediaan fitur-fitur modern yang membuat pengalaman bermain semakin menyenangkan dan tidak membosankan.
- Di era modern seperti sekarang, kecepatan dan keamanan menjadi hal utama dalam memilih layanan daring. Salah satu platform yang banyak dibicarakan adalah Sabatoto karena mampu menghadirkan sistem yang stabil dan responsif. Pengguna merasa lebih percaya diri ketika menggunakan layanan yang telah diuji kualitasnya. Dengan sistem transaksi cepat dan antarmuka ramah pengguna, layanan ini menjadi pilihan utama bagi banyak kalangan.
- Beragam layanan hiburan kini hadir dalam genggaman, menawarkan sensasi yang lebih seru dan cepat diakses. Salah satu nama yang terus mencuat adalah Sabatoto, dikenal karena sistem keamanannya yang mumpuni. Kepercayaan pengguna pun meningkat seiring konsistensi layanan yang diberikan. Tak heran jika banyak komunitas daring merekomendasikan platform ini kepada rekan-rekan mereka sebagai tempat yang nyaman dan terpercaya.
- Dunia hiburan digital semakin kompetitif, dengan berbagai penyedia layanan yang menawarkan fitur canggih. Salah satu nama yang mencuri perhatian adalah Pedetogel, yang dikenal mampu menjaga performa layanan tetap stabil. Platform ini juga rutin memperbarui sistem keamanan demi kenyamanan para penggunanya. Tak mengherankan jika kepercayaan publik terus meningkat setiap harinya.
