Sep172015
In Part 4, you’ll learn tips for starting your presentation with a bang, sustaining your audience’s interest throughout your entire talk, and handling audience questions during and after your presentation.
In Part 4, you’ll learn tips for starting your presentation with a bang, sustaining your audience’s interest throughout your entire talk, and handling audience questions during and after your presentation.
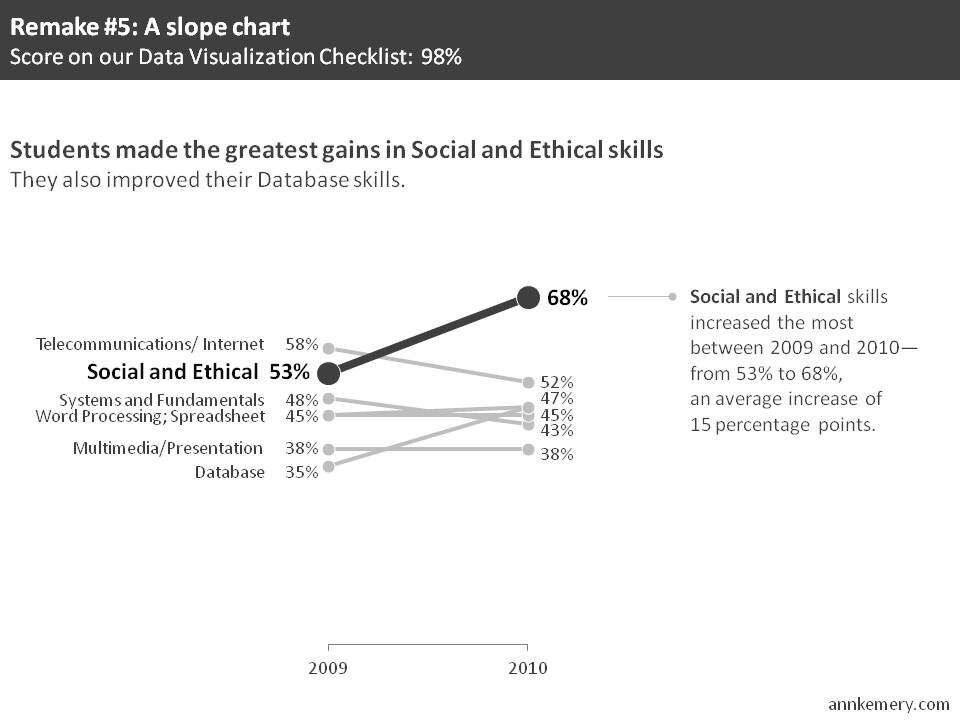
In Part 3, you’ll learn practical graphing guidelines, like how many graphs can really fit on one slide, which font size is needed for those audience members sitting in the back row of your presentation, how to select the correct chart type for your dataset, and tips for selecting colors that will make your key findings stand out.
Part 2 will showcase real AEA member slides, redesigned. You’ll learn how AEA members incorporated high-quality images, reduced clutter, and highlighted key points with emphasis colors.
On behalf of the American Evaluation Association’s Data Visualization and Reporting group and the Potent Presentations Initiative, Stephanie Evergreen and I are leading a four-part Slide Clinic. Part 1 will cover lightning fast advice on honing the message of your conference presentation and structuring your session so that you can connect with the audience.

This June, I’m facilitating a four-week online course in partnership with TechChange. Live webinars, recorded videos, interactive discussions, hands-on practice, and more!
I’m teaming up with Stephanie Evergreen of Evergreen Data and Gavin McMahon of fassforward consulting to teach a data visualization workshop for Verizon Wireless staff.
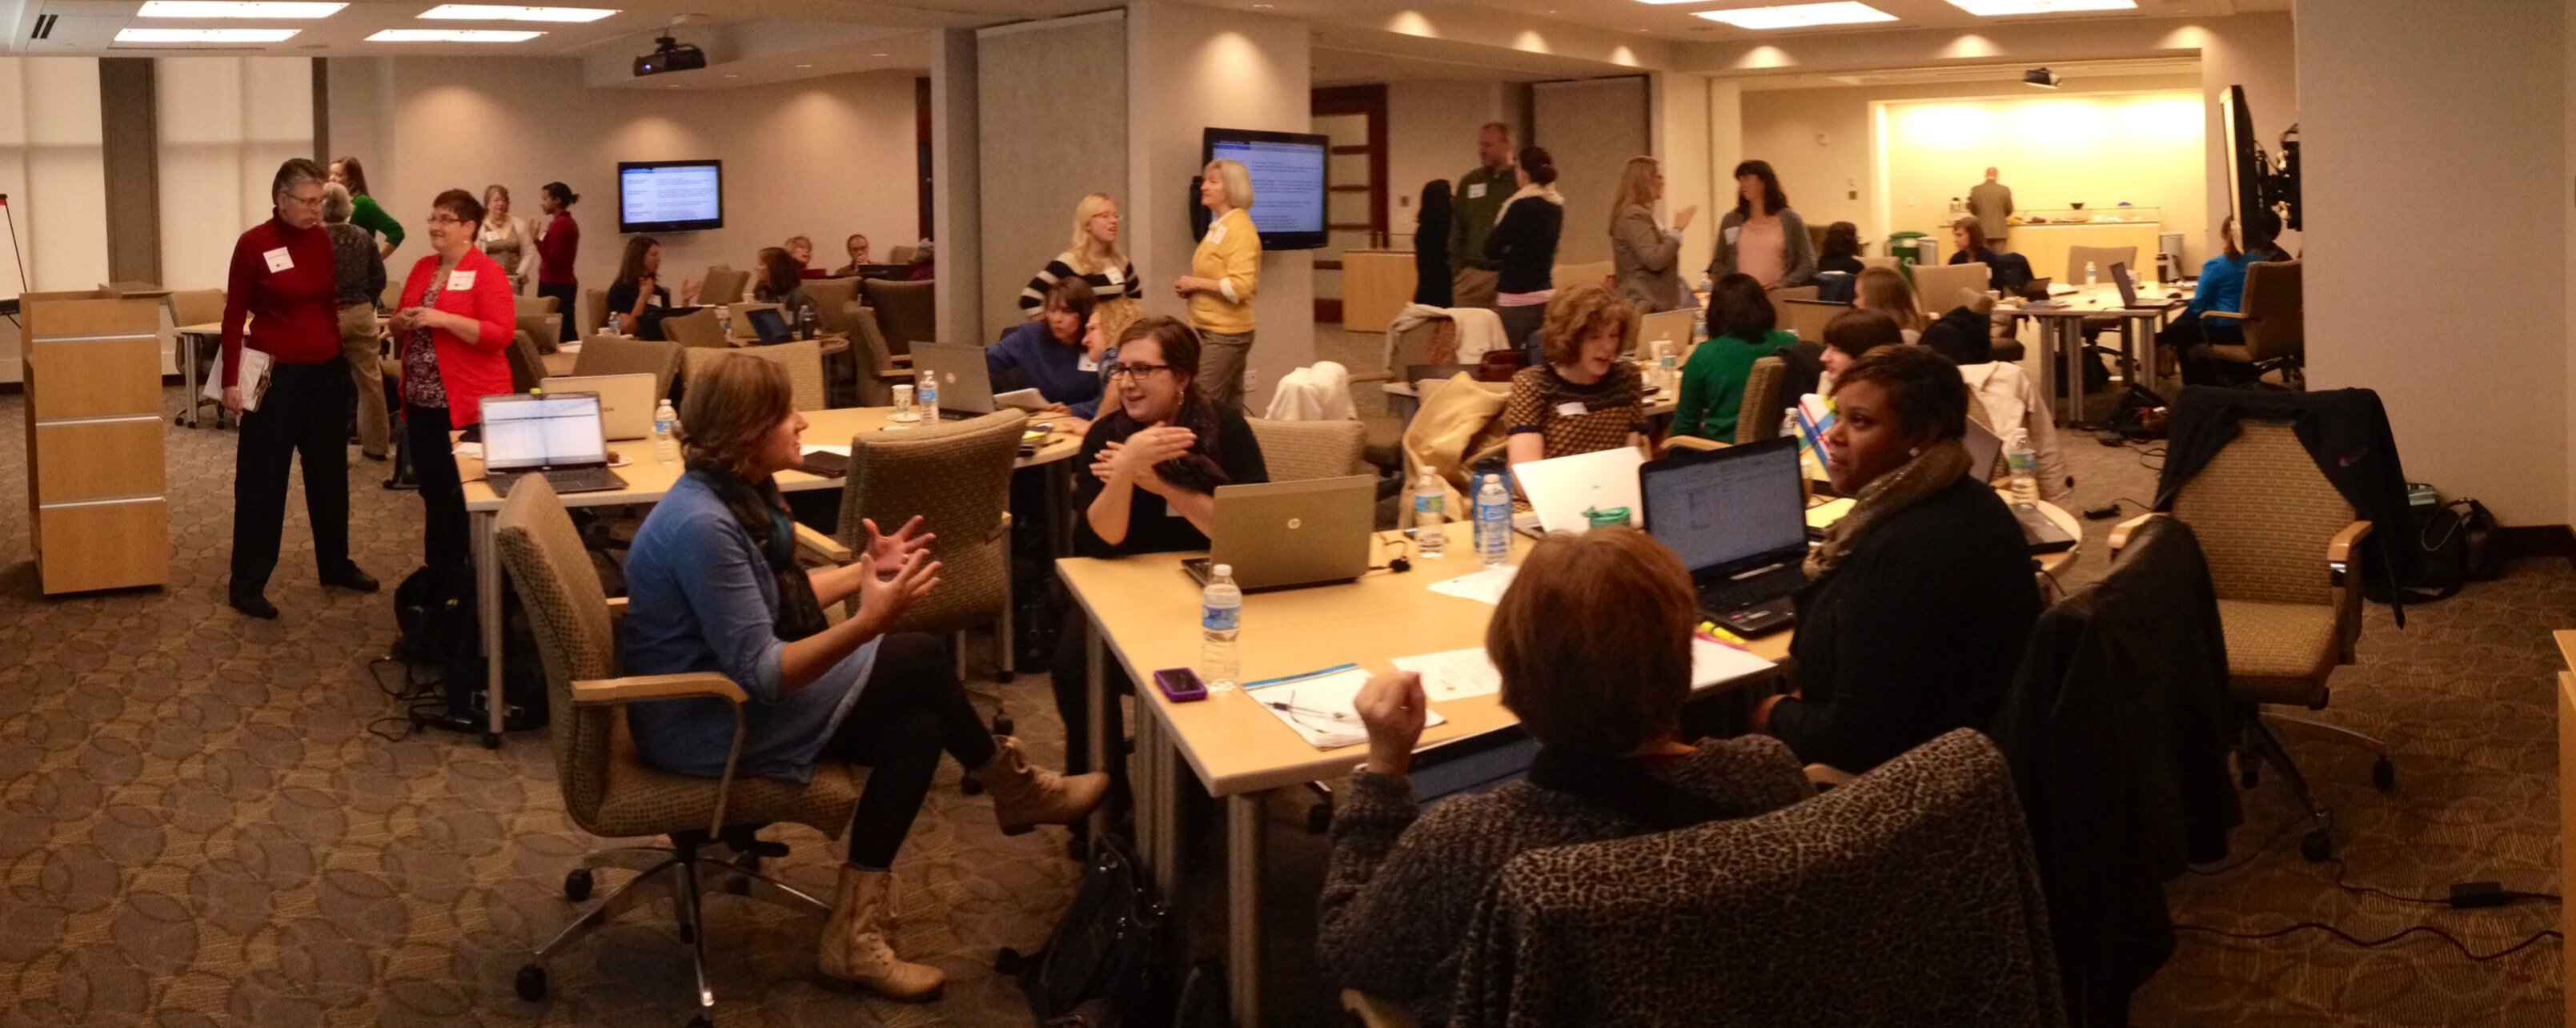
Save the date! On Thursday, December 11, I’ll be co-leading a data visualization workshop with Stephanie Evergreen in Washington, DC.
I’ve been building portfolios of my work for a while. Over the past year or so I’ve been building an online portfolio of speaking and writing engagements. Before that, I collected paper copies of reports I worked on: Before The great sobering thing about portfolios is that…
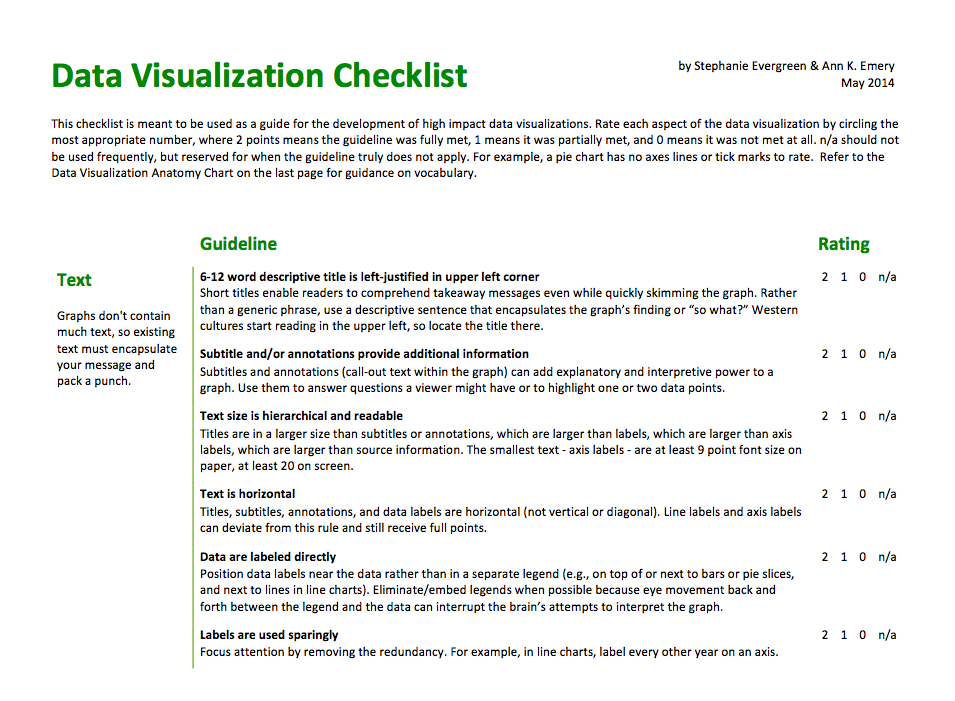
This post has been a long time coming. Stephanie Evergreen and I knew some time ago that evaluators and social scientists had a thirst for better graphs, a clear understanding of why better graphs were necessary, but they lacked efficient guidance on how, exactly, to make…