Dec152015
6 Comments
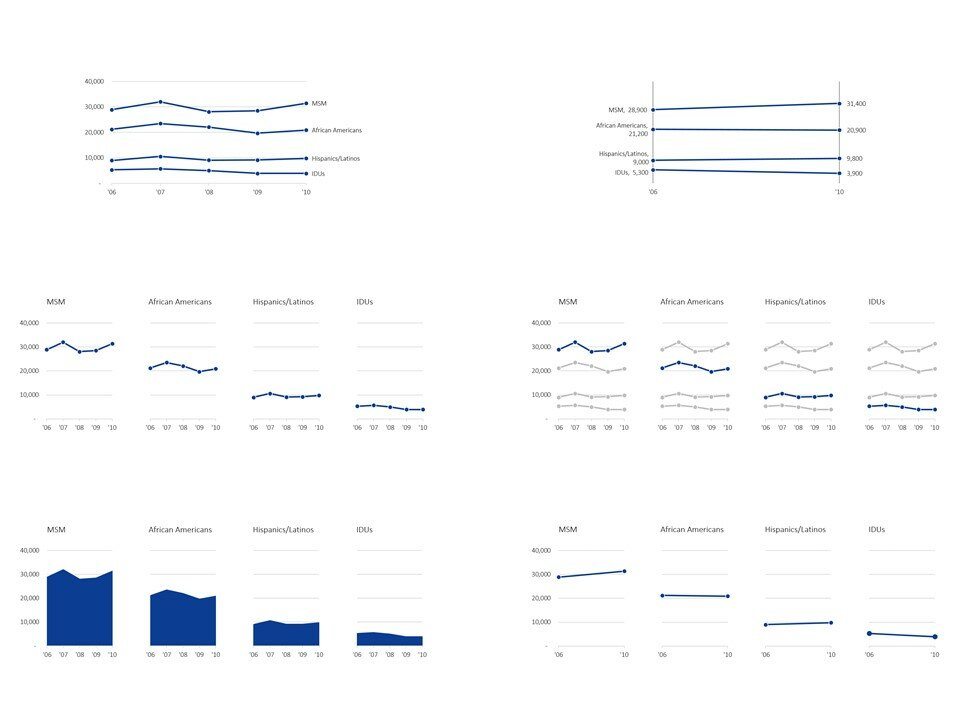
I recently partnered with a group of public health researchers. We were brainstorming different ways to display the number of new HIV infections in each subgroup. The organization wanted to compare HIV infections among men who have sex with men (MSM), African Americans, Hispanics/Latinos, and injection…