Tag archive for Excel elbow grease - page 2

Dataviz Challenge #4: Can You Make a Small Multiples Bar Chart?

Dataviz Challenge #4: Can You Make a Small Multiples Bar Chart?

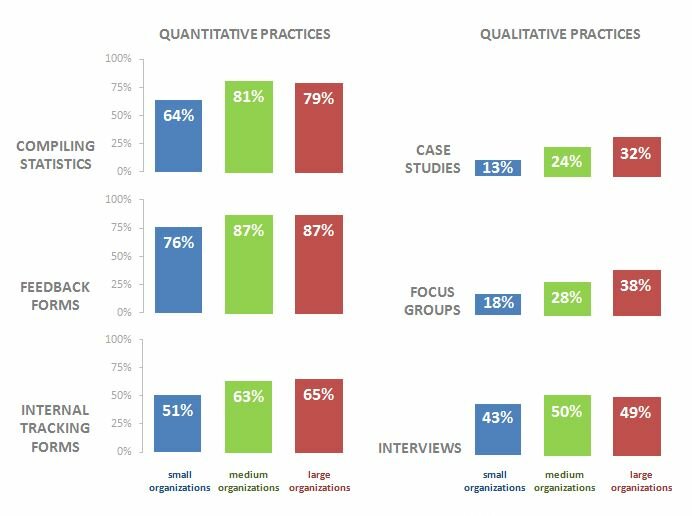
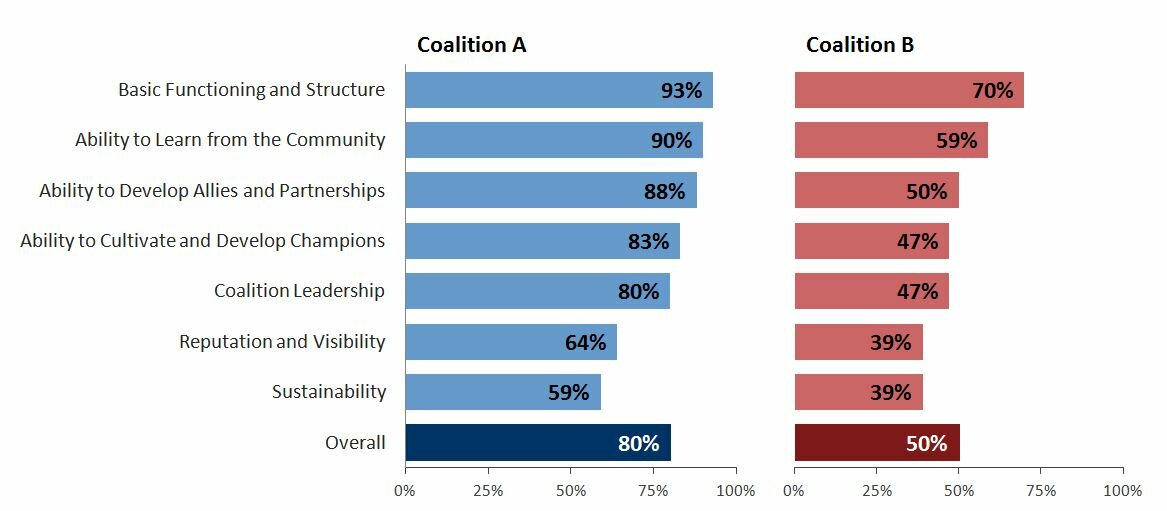
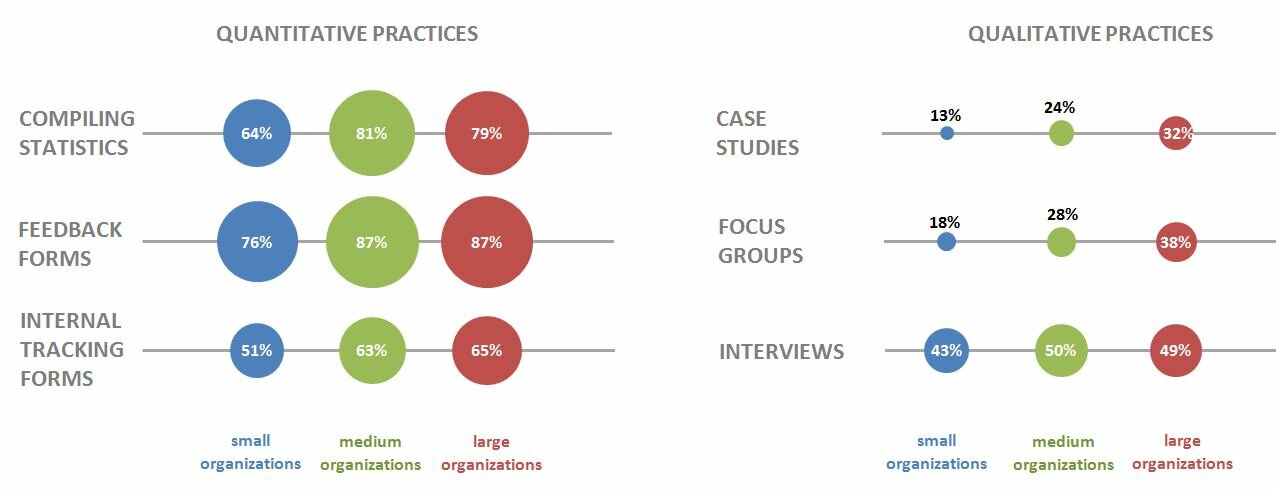
In the third dataviz challenge, we started talking about making several comparisons at once. For example, when the Innovation Network team and I surveyed nonprofits in the State of Evaluation 2012 research, we found differences between small, medium, and large nonprofits’ evaluation practices and capacity….

Continue reading →

Dataviz Challenge #3: Alternate Solution by Paul Denninger

Dataviz Challenge #3: Alternate Solution by Paul Denninger

Note from Ann: Last week I shared a dataviz how-to guide. Paul Denninger has a great alternative solution to share! He uses hidden bars, also known in the Excel community as floating bars or white bars, to build “two” charts in one. Enjoy! Getting excel…

Continue reading →

Dataviz Challenge #3: How to Make a Side by Side Bar Chart in Excel

Dataviz Challenge #3: How to Make a Side by Side Bar Chart in Excel

Two weeks ago, I challenged readers to re-create the “after” version of a side by side bar chart. You can read the full post here. Congratulations to the 9 contestants! Click on the contestant’s name to see their chart. Regan Grandy Sara Vaca Alex Kadis…

Continue reading →

Dataviz Challenge #3: Can You Make a Side by Side Bar Chart?

Dataviz Challenge #3: Can You Make a Side by Side Bar Chart?

Thanks to everyone who participated in the first and second dataviz challenges! I hope these challenges give you a chance to practice and build upon your Excel and visualization skills. Last time, we made a streamlined version of the basic bar chart by adjusting Excel’s…

Continue reading →

Dataviz Challenge #2: How to Make a Basic Bar Chart

Dataviz Challenge #2: How to Make a Basic Bar Chart

Two weeks ago, I challenged readers to re-create the “after” version of a basic bar chart. You can read the full post here. Congratulations to the 9 winners: Molly Hamm, David Napoli, Susan Kistler, Jon Schwabish, Ethan, Mike, Sara Vaca, Samantha Grant, and Kevin Gilds! You’ve…

Continue reading →

Dataviz Challenge #2: Can You Make a Basic Bar Chart?

Dataviz Challenge #2: Can You Make a Basic Bar Chart?

The first dataviz challenge was a hit! A few of you wanted to participate but weren’t ready to jump into a challenge that required so much Excel elbow grease. So, this second challenge is geared towards beginners like you. Once I build your foundational skills,…

Continue reading →

Dataviz Challenge #1: How to Make a Circle Chart in Excel

Dataviz Challenge #1: How to Make a Circle Chart in Excel

Two weeks ago, I challenged readers to reproduce a circle chart from Innovation Network’s State of Evaluation 2012 report — using only Microsoft Excel or R. You can read the full blog post here. And the winners are… Tony Fujs, Andrea Hutson, Prince Rajan, and…

Continue reading →

Page 2 of 2 1 2

Related Links:

Togel178

Pedetogel

Sabatoto

Togel279

Togel158

Colok178

Novaslot88

Lain-Lain

Partner Links