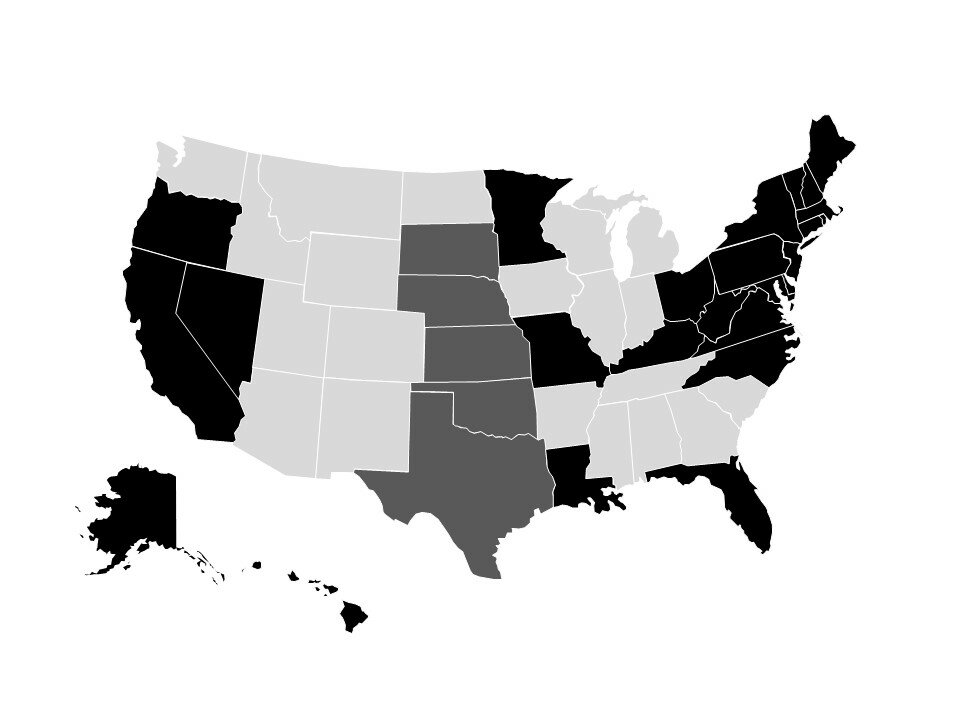
Heat Maps
Higher numbers are darker, lower numbers are lighter.
Tools
- Presentation Magazine’s editable maps
- Tableau
- Carto
Examples
- Non-vegetarianism in India in three maps
- Poverty rates by US counties
- Roads are becoming more deadly in developing countries
- What are sanctuary cities?
- How Trump’s refugee ban hurts health care in places that voted for him
- Spring came early; scientists say climate change is a culprit
- Change in percent of uninsured population
- 70 countries have had a female leader
- Median ages of residents in African countries
- Mapping every deficient bridge in the United States
- Where America’s goats live
- Where America’s cows live
Small multiples examples
- Three ways you could draw Pennsylvania’s congressional districts
- What music do Americans love the most? 50 detailed maps of music fandom
- Gerrymandering
- Republicans’ changes to Medicaid could have larger impact than their changes to Obamacare
- White overrepresentation: 1980, 2016, 2016
- 176 drought maps reveal just how thirsty California has become
- How the California drought has spread between 2011 and 2015
- Wal-Mart’s urban spread between 2005 and 2020
- Gerrymandering between the 83rd Congress and 115th Congress
- Percentage of Catholics vs. Protestants in South America saying x is morally wrong