Tag archive for Reports

A Two-Hour Turnaround: How to Transform a Text-Heavy Report into a Visual-Lite Report

A Two-Hour Turnaround: How to Transform a Text-Heavy Report into a Visual-Lite Report

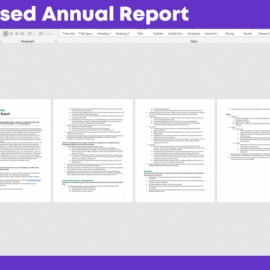
Most of my early reports looked exactly like this: a few pages of 11-point font and some bullet points here and there. Except… Mine were way worse! I loved to write 100 pages of 11-point font and bullet points instead of these four summarized pages….

Continue reading →

How to Objectively Measure Text Readability (and Lower Your Graph’s Reading Level)

How to Objectively Measure Text Readability (and Lower Your Graph’s Reading Level)

If viewers can’t read your graph, why bother making it? Accessibility is at the top of my priority list. A lot of things go into a data visualization’s readability, including: the graph type you select (3D exploding pie charts with 999 slices are inherently hard…

Continue reading →

How to Write Your Reports in PowerPoint Instead of Word: Nine Tips for Getting Started

How to Write Your Reports in PowerPoint Instead of Word: Nine Tips for Getting Started

Hi! My name is Nick Visscher, I’m an internal evaluator with Denver Zoo. Our data work spans the gamut from collecting guest satisfaction insights to observing preschool kids in our nature play programming. With everything our team does we aim to help our staff improve…

Continue reading →

Soar Beyond the Dusty Shelf Report: New Online Course

Soar Beyond the Dusty Shelf Report: New Online Course

Nothing bothers me more than watching important information decay inside of Dusty Shelf Reports. Most “professional” reports are long, dense, unused, and forgotten about. Unfortunately I’ve got plenty of personal experience with Dusty Shelf Reports…   I used to write hundred-page reports for everyday people that had…

Continue reading →

It’s Not You, It’s Me: When You Realize Your Reports, Not Your Readers, Are the Problem

It’s Not You, It’s Me: When You Realize Your Reports, Not Your Readers, Are the Problem

I met Audrey Loper in 2017 while teaching a data visualization workshop to her grantees. Her data visualization progress after that workshop has been phenomenal. Keep up the good work, Audrey! A few years ago, I found myself in a frustrating predicament. I was writing…

Continue reading →

Page 1 of 3 1 2 3

Related Links:

Togel178

Pedetogel

Sabatoto

Togel279

Togel158

Colok178

Novaslot88

Lain-Lain

Partner Links