Tag archive for Excel elbow grease

From Data Table to Small Multiples in Under 5 Minutes

From Data Table to Small Multiples in Under 5 Minutes

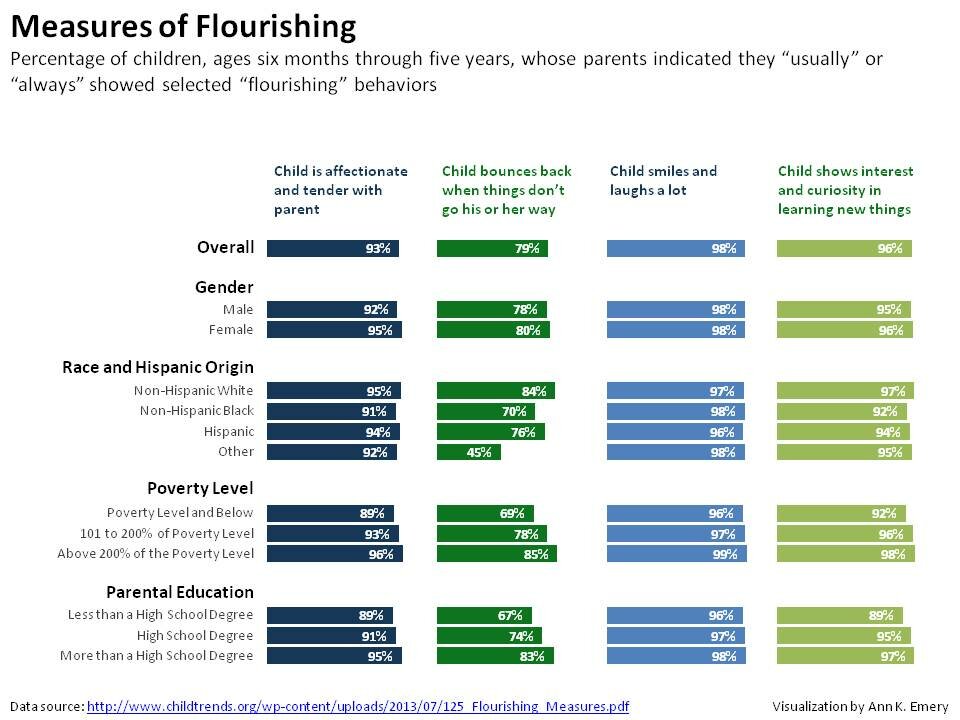
When social scientists like me have lots of data, we tend to put it in tables. There’s nothing wrong with tables. They contain infinite details within a finite and teeny space, and they give the reader freedom to draw his or her own conclusions about which details…

Continue reading →

The Dataviz Design Process: 7 Steps for Beginners

The Dataviz Design Process: 7 Steps for Beginners

Does data visualization leave you feeling like this? If so, this beginner-level post is for you! Data visualization requires two skillsets: technical skills to create visualizations in a software program and critical thinking skills to match your visualization to your audience’s information needs, numeracy level,…

Continue reading →

Dataviz Challenge #6: Can You Make a Unit Chart?

Dataviz Challenge #6: Can You Make a Unit Chart?

Lately I’ve been feeling let down by summary statistics: the min and max, mean and median, quartiles and standard deviation… They do their job well enough. Summary statistics tell a summary. An aggregate story, bringing all the messy scores together into some sort of cohesion. We…

Continue reading →

Dataviz Challenge #5: How to Make a Diverging Stacked Bar Chart in Excel

Dataviz Challenge #5: How to Make a Diverging Stacked Bar Chart in Excel

I’ve been in love with diverging stacked bar charts since I saw Joe Mako’s submission to Cole Nussbaumer’s dataviz challenge last December. Joe made this contest-winning chart. But in Tableau! The amazing but expensive software! Could I ever create one in Excel?! Yes! Luckily I’d…

Continue reading →

Dataviz Challenge #5: Can You Make a Diverging Stacked Bar Chart?

Dataviz Challenge #5: Can You Make a Diverging Stacked Bar Chart?

Last week I shared strategies for improving any chart’s colors. One of the examples was a diverging stacked bar chart: I love stacked bar charts because they’re pretty versatile, and because they’re a great chart for lots of evaluation and survey data. In my example,…

Continue reading →

Page 1 of 3 1 2 3

Related Links:

Togel178

Pedetogel

Sabatoto

Togel279

Togel158

Colok178

Novaslot88

Lain-Lain

Partner Links