Tag archive for data storytelling

Will you present the data as-is, or tell a story?

Will you present the data as-is, or tell a story?

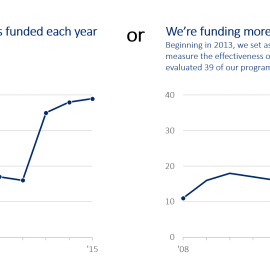
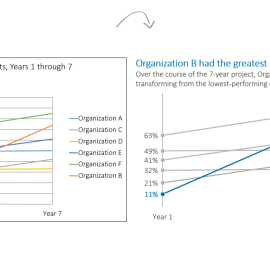
Viewer considerations are key: What type of information do your viewers need to see? What information do they already have? What information are they expecting? How many points in time should be included? Will you present aggregated or disaggregated findings? How long do you anticipate…

Continue reading →

The Simplification & Emphasis Approach to Editing Graphs

The Simplification & Emphasis Approach to Editing Graphs

I teach about data visualization a lot. And it basically comes down to two techniques: simplification and emphasis. Here’s a default graph with fictional data: First, simplify the graph. Remove the border. Remove the horizontal grid lines. Remove the vertical axis. Remove the legend. Remove…

Continue reading →

Related Links:

Togel178

Pedetogel

Sabatoto

Togel279

Togel158

Colok178

Novaslot88

Lain-Lain

Partner Links