Tag archive for Color-Coding by Category

A Two-Hour Turnaround: How to Transform a Text-Heavy Report into a Visual-Lite Report

A Two-Hour Turnaround: How to Transform a Text-Heavy Report into a Visual-Lite Report

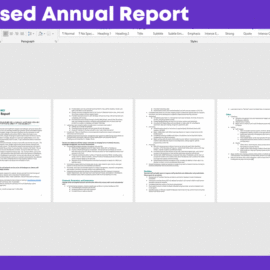
Most of my early reports looked exactly like this: a few pages of 11-point font and some bullet points here and there. Except… Mine were way worse! I loved to write 100 pages of 11-point font and bullet points instead of these four summarized pages….

Continue reading →

How to Visually Structure Your Presentation Around Key Points

How to Visually Structure Your Presentation Around Key Points

There’s nothing worse than presentations that drone on without a clear message. You know the feeling: You’re sitting in the audience at a conference. The speaker goes on and on. And on. And on. Later, someone asks what you learned from the presentation. You remember…

Continue reading →

Home Visiting Dataviz: Three Steps to Making a Good Graph Great

Home Visiting Dataviz: Three Steps to Making a Good Graph Great

Whether you’re visiting a web site or a listening to a presentation, you’ve probably thought about data visualization as a helpful way to digest complex information. At its best, “data viz” communicates data simply and efficiently using a combination of graphs, graphics, and other forms…

Continue reading →

How to Visualize Workshop Evaluation Results

How to Visualize Workshop Evaluation Results

I give dozens of workshops, webinars, and conference keynotes each year. Which means I receive dozens of evaluation surveys each year. After my sessions, the clients who sponsored the workshop ask their participants to rate my session. Sometimes the satisfaction surveys are electronic. Other times, the satisfaction…

Continue reading →

How to Visualize Statistically Significant P-Values with Squares

How to Visualize Statistically Significant P-Values with Squares

Last year I teamed up with an organization on a custom design project. We wanted to show their leaders where one of their programs for children had been effective. Like most in-house research teams, this team had a lot of data. The researchers had spent…

Continue reading →

Page 1 of 2 1 2

Related Links:

Togel178

Pedetogel

Sabatoto

Togel279

Togel158

Colok178

Novaslot88

Lain-Lain

Partner Links