Tag archive for bar chart

Disaggregating with Small Multiples

Disaggregating with Small Multiples

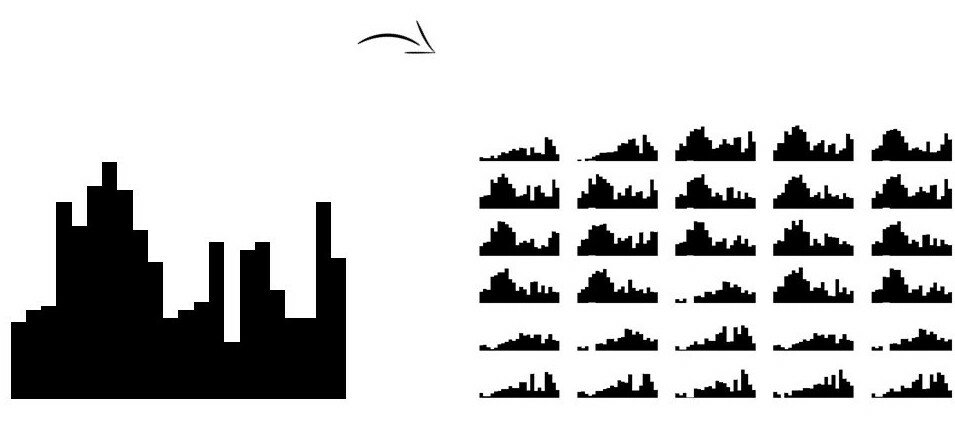
Los Angeles, San Francisco, Denver, Buffalo, Indianapolis, Milwaukee, Kampala, DC… it’s been a wonderful few months in the data visualization workshop world!   My favorite part of data visualization workshops? The airports. Kidding. Watching jaws drop when folks are introduced to small multiples layouts for…

Continue reading →

New-ish Charts for Evaluation

New-ish Charts for Evaluation

You know the drill: Better charts = better communication = better understanding = better decision making. Whether you’re trying to highlight the most important findings, simplify that lengthy report, or just get someone to open your report in the first place, charts can be one…

Continue reading →

Dataviz Challenge #3: How to Make a Side by Side Bar Chart in Excel

Dataviz Challenge #3: How to Make a Side by Side Bar Chart in Excel

Two weeks ago, I challenged readers to re-create the “after” version of a side by side bar chart. You can read the full post here. Congratulations to the 9 contestants! Click on the contestant’s name to see their chart. Regan Grandy Sara Vaca Alex Kadis…

Continue reading →

Dataviz Challenge #3: Can You Make a Side by Side Bar Chart?

Dataviz Challenge #3: Can You Make a Side by Side Bar Chart?

Thanks to everyone who participated in the first and second dataviz challenges! I hope these challenges give you a chance to practice and build upon your Excel and visualization skills. Last time, we made a streamlined version of the basic bar chart by adjusting Excel’s…

Continue reading →

Related Links:

Togel178

Pedetogel

Sabatoto

Togel279

Togel158

Colok178

Novaslot88

Lain-Lain

Partner Links