Tag archive for Analysis

Public Webinar: Analyzing Data in Excel

Public Webinar: Analyzing Data in Excel

Ever feel like you’re swimming upstream in data? Need to make sense of spreadsheets, but not sure where to start? Have a gut feeling that you’re not getting the most out of common software programs like Microsoft Excel? During this three-hour webinar, I’ll guide you through the entire data analysis process. This webinar is highly interactive; I’ll demonstrate a skill and give you opportunities to practice immediately.

Continue reading →

Do Good Data 2015: Visualizing Research and Evaluation Results in, Yes, Excel

Do Good Data 2015: Visualizing Research and Evaluation Results in, Yes, Excel

I’m leading a data visualization session at Do Good Data 2015 in Chicago.

Continue reading →

Public Webinar: Excel Dashboards via Drop-Down Menus

Public Webinar: Excel Dashboards via Drop-Down Menus

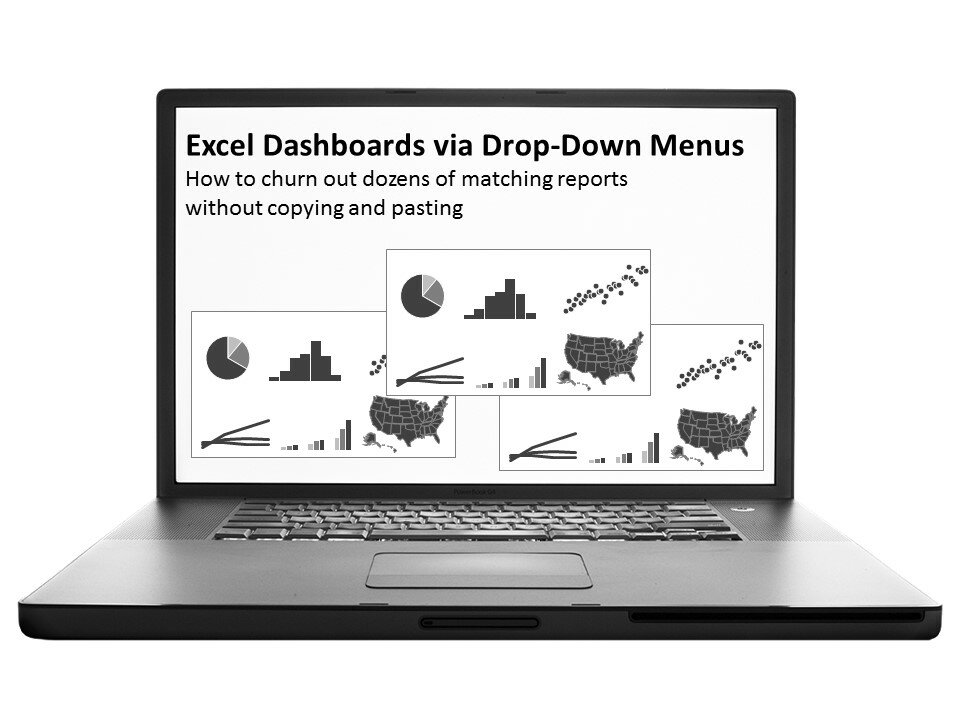
Need to churn out dozens of matching visual reports — one per company, school, program, city, etc — but don’t have the time or energy to copy and paste back and forth a million times between Excel and Word? First, I’ll give you a quick overview…

Continue reading →

Public Webinar: Saving Time and Energy with Pivot Tables

Public Webinar: Saving Time and Energy with Pivot Tables

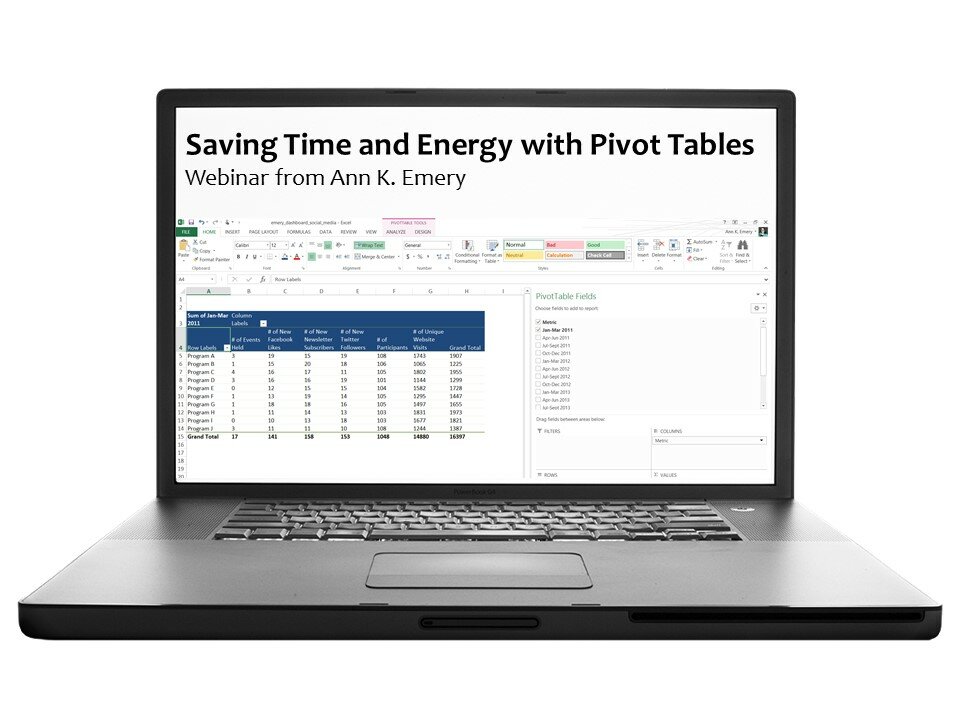
Pivot tables are the fastest, easiest way to make sense of spreadsheets. Whether you spend 10% or 100% of your day working with data, pivot tables are a must-have spreadsheet skill. In this 90-minute webinar, you’ll learn how to: design your spreadsheet to be compatible…

Continue reading →

Public Workshop: Practical Data Visualization

Public Workshop: Practical Data Visualization

Save the date! On Thursday, December 11, I’ll be co-leading a data visualization workshop with Stephanie Evergreen in Washington, DC.

Continue reading →

Public Webinar: Excel Dashboards via Drop-Down Menus

Public Webinar: Excel Dashboards via Drop-Down Menus

During this 60-minute webinar, I’ll demonstrate how to create Excel-based dashboards through drop-down menus. First, I’ll give you a quick overview of the technique. Next, I’ll build a snapshot from scratch so that you’ll know what to do first, second, and third. Finally, you’ll get…

Continue reading →

Public Workshop Hosted by the Indiana Evaluation Association

Public Workshop Hosted by the Indiana Evaluation Association

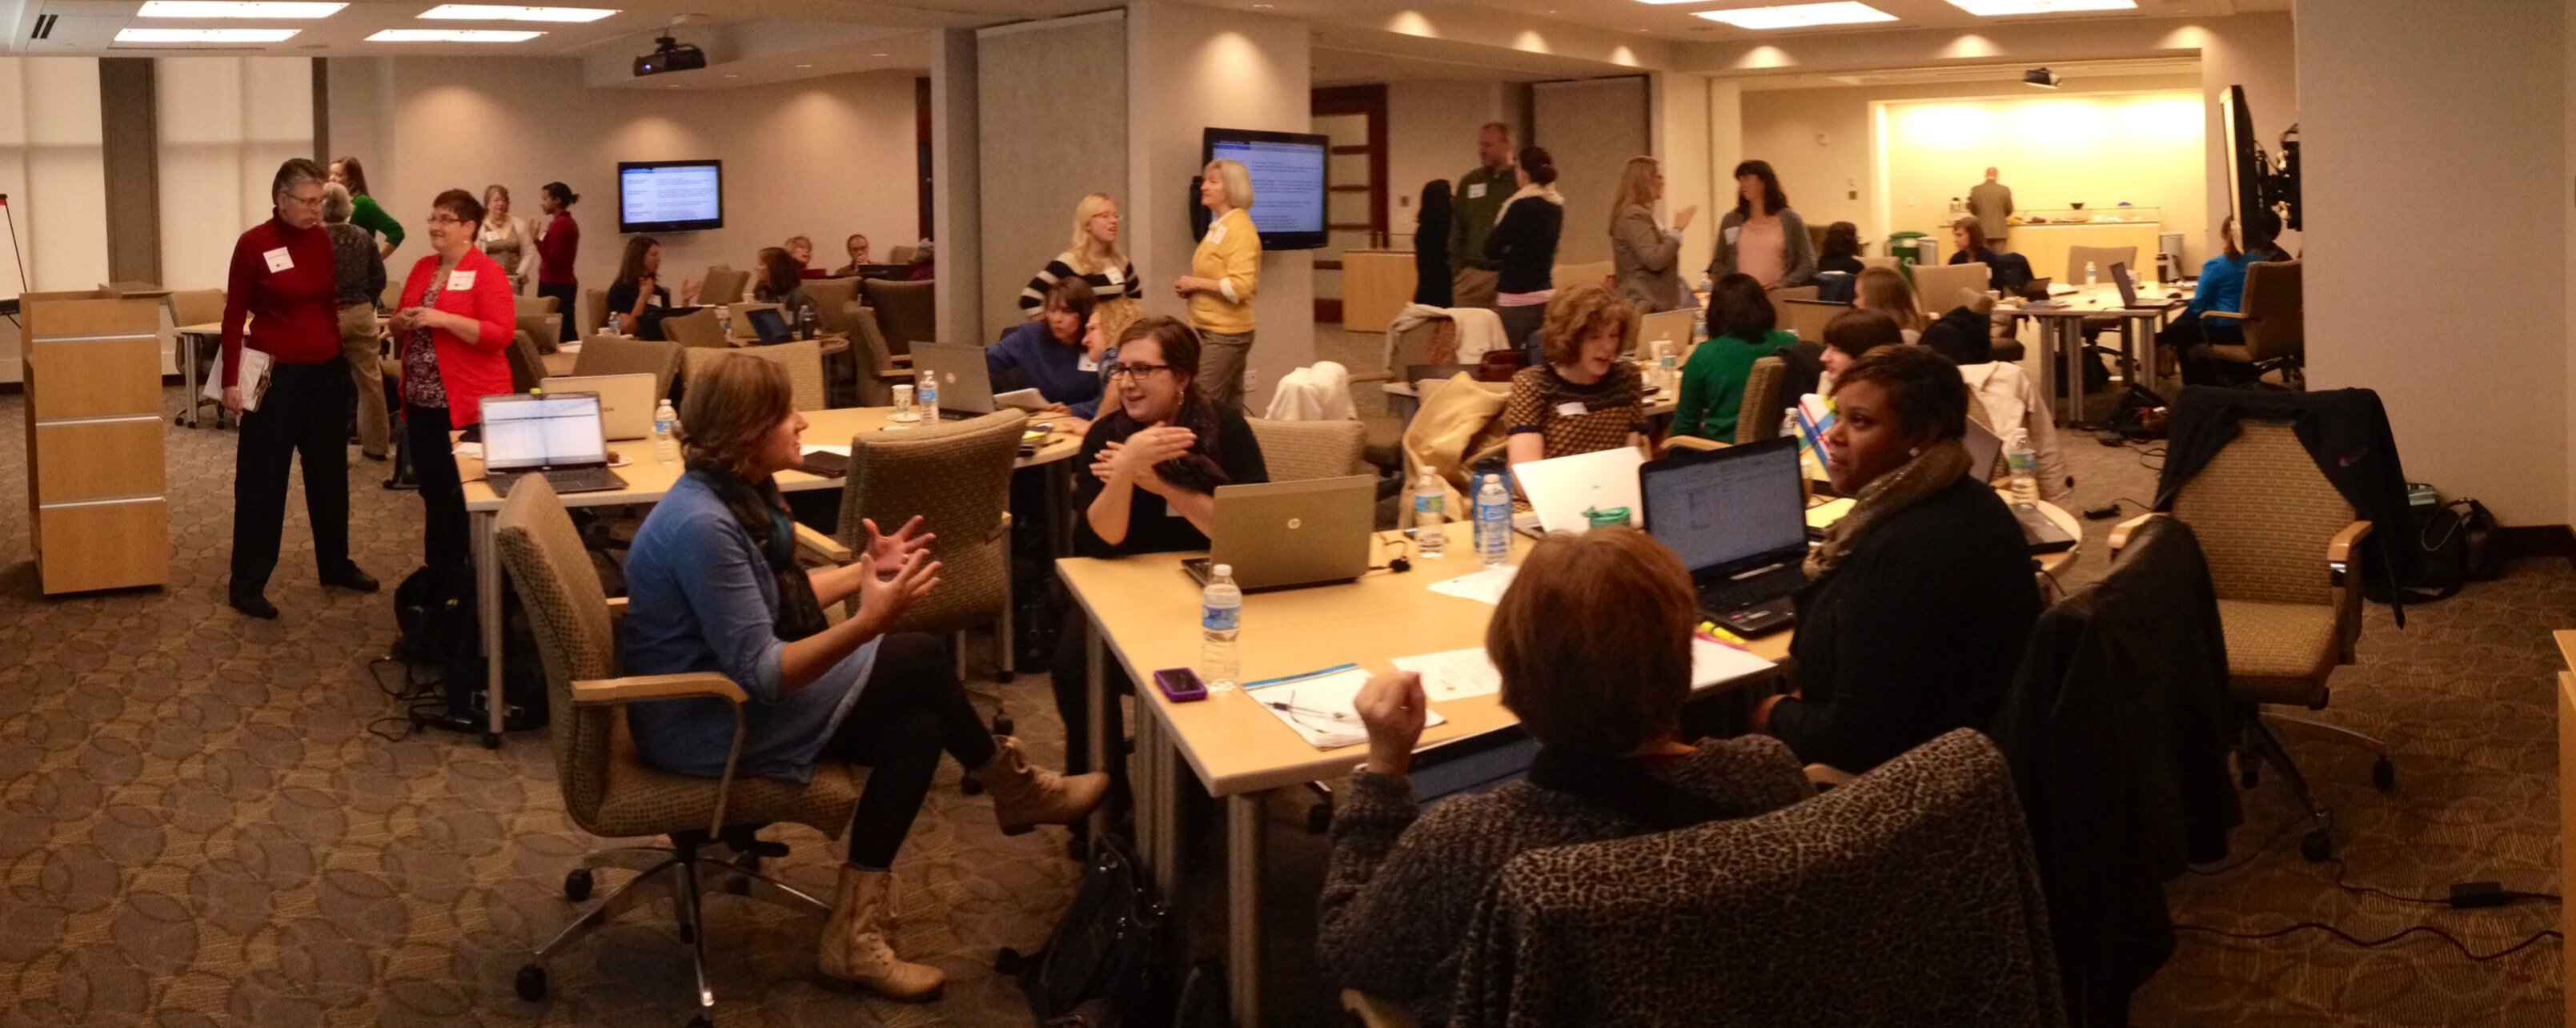
I’m teaching Indiana Evaluation Association members about data analysis and data visualization.

Continue reading →

Private Workshop: Community Connections of New York

Private Workshop: Community Connections of New York

Private workshop

Continue reading →

M&E Tech Conference: What’s Next in Visualizing Data for Better Decision Making?

M&E Tech Conference: What’s Next in Visualizing Data for Better Decision Making?

I’ll be discussing data visualization trends and tools at the M&E Tech DC conference along with Kendra Keith, Rachel Trichler, and Taylor Corbett.

Continue reading →

=vlookup(): One Excel function to rule them all

=vlookup(): One Excel function to rule them all

I’m celebrating 100,000 YouTube views with an article on my favorite spreadsheet function: vlookup! Vlookup is for merging and combining datasets, like when you’ve got program participants’ demographic data in one place and their scores or outcomes in another place. I can’t tell you how many…

Continue reading →

Page 1 of 2 1 2

Related Links:

Togel178

Pedetogel

Sabatoto

Togel279

Togel158

Colok178

Novaslot88

Lain-Lain

Partner Links