Archive for Templates - page 2

Pie Chart Makeover: Revenue and Expenses

Pie Chart Makeover: Revenue and Expenses

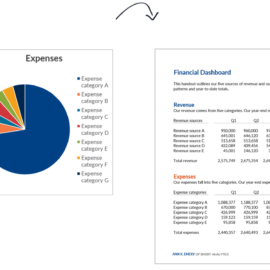
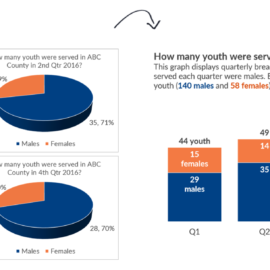
A couple weeks ago I was in Birmingham with the Alabama Power Company’s grantees. We spent two days learning data visualization principles and producing makeovers of their graphs.   Before One of the grantees was presenting their revenue and expenses data like this, in two…

Continue reading →

Pie Chart Makeover: Quarterly Breakouts by Gender

Pie Chart Makeover: Quarterly Breakouts by Gender

A few weeks ago I was in Indianapolis with the juvenile detention alternatives initiative. This group wanted to graph: how many youth went to juvenile detention centers, by gender, and by quarter. Brainstorming There are a dozen ways to graph each dataset. For this data,…

Continue reading →

Sorting Your Bar Charts

Sorting Your Bar Charts

“Ann, my bar chart is upside down! Help!” You read my prior post about using horizontal bar charts for nominal variables like favorite fruits. My toddler is eating two! bananas a day so bananas are the winner in this fictional fruit contest. Our original table…

Continue reading →

Bar Charts: Vertical or Horizontal?

Bar Charts: Vertical or Horizontal?

“Ann, should my bar charts be horizontal or vertical?” Ordinal variables get vertical bars Ordinal variables follow a natural progression—an order. I arrange ordinal categories from left to right so my viewers can view the sequence across the page, which means their bars are vertical. Use…

Continue reading →

Bar Charts: Regular or Stacked?

Bar Charts: Regular or Stacked?

Chart choosing is part art and part science. During workshops, I cover my chart choosing thought process in more detail. For now, let me save you hours of time with this not-so-secret secret: Start with a bar chart. Then, fine-tine your bar chart. Try your…

Continue reading →

Page 2 of 3 1 2 3

Related Links:

Togel178

Pedetogel

Sabatoto

Togel279

Togel158

Colok178

Novaslot88

Lain-Lain

Partner Links