Archive for Visualizing Data

Sorting Your Bar Charts

Sorting Your Bar Charts

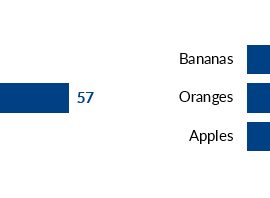
“Ann, my bar chart is upside down! Help!” You read my prior post about using horizontal bar charts for nominal variables like favorite fruits. My toddler is eating two! bananas a day so bananas are the winner in this fictional fruit contest. Our original table…

Continue reading →

Removing Redundancies from My Old Graphs

Removing Redundancies from My Old Graphs

This morning I keynoted a conference in Tallahassee. Data visualizers who critique others before critiquing themselves make me gag, so I opened my talk with a trip down memory lane. Check out this beauty from one of my earliest jobs. I’ve anonymized it but 99.9% of…

Continue reading →

Flipping Your Bar Charts

Flipping Your Bar Charts

“Ann, I read your latest post, and I accidentally made a horizontal bar chart when it should’ve been a vertical bar chart! Am I going to have to delete my graph and start from scratch?” No way. Don’t delete a thing. That would be a huge waste…

Continue reading →

Bar Charts: Vertical or Horizontal?

Bar Charts: Vertical or Horizontal?

“Ann, should my bar charts be horizontal or vertical?” Ordinal variables get vertical bars Ordinal variables follow a natural progression—an order. I arrange ordinal categories from left to right so my viewers can view the sequence across the page, which means their bars are vertical. Use…

Continue reading →

Bar Charts: Regular or Stacked?

Bar Charts: Regular or Stacked?

Chart choosing is part art and part science. During workshops, I cover my chart choosing thought process in more detail. For now, let me save you hours of time with this not-so-secret secret: Start with a bar chart. Then, fine-tine your bar chart. Try your…

Continue reading →

Page 1 of 26 1 2 3 4 5 ... Last →

Related Links:

Togel178

Pedetogel

Sabatoto

Togel279

Togel158

Colok178

Novaslot88

Lain-Lain

Partner Links