Archive for Excel for Evaluation

=vlookup(): One Excel function to rule them all

=vlookup(): One Excel function to rule them all

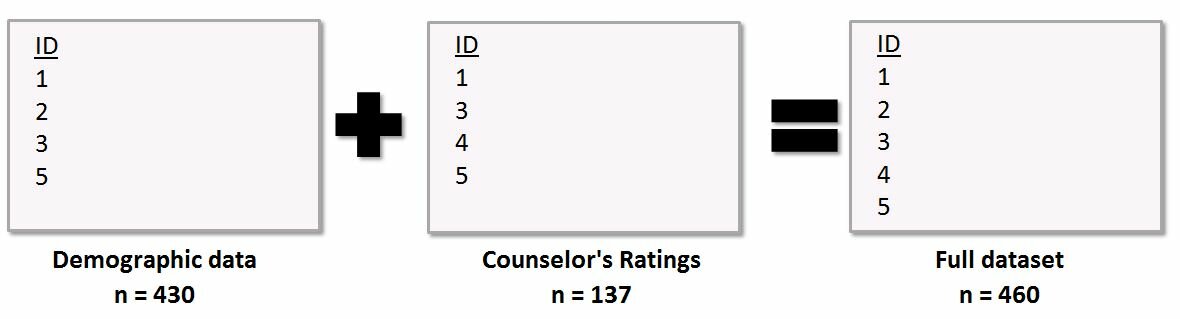
I’m celebrating 100,000 YouTube views with an article on my favorite spreadsheet function: vlookup! Vlookup is for merging and combining datasets, like when you’ve got program participants’ demographic data in one place and their scores or outcomes in another place. I can’t tell you how many…

Continue reading →

Four Steps: Social Network Analysis by Twitter Hashtag with NodeXL [Guest post by Johanna Morariu]

Four Steps: Social Network Analysis by Twitter Hashtag with NodeXL [Guest post by Johanna Morariu]

Note from Ann: Today’s guest post is from Johanna Morariu, Director of Innovation Network, AEA DVRTIG Chair, and dataviz aficionado. Basic social network analysis is something EVERYONE can do. So let’s try out one social network analysis tool, NodeXL, and take a peek at the…

Continue reading →

Dataviz Challenge #6: Can You Make a Unit Chart?

Dataviz Challenge #6: Can You Make a Unit Chart?

Lately I’ve been feeling let down by summary statistics: the min and max, mean and median, quartiles and standard deviation… They do their job well enough. Summary statistics tell a summary. An aggregate story, bringing all the messy scores together into some sort of cohesion. We…

Continue reading →

Dataviz Challenge #5: How to Make a Diverging Stacked Bar Chart in Excel

Dataviz Challenge #5: How to Make a Diverging Stacked Bar Chart in Excel

I’ve been in love with diverging stacked bar charts since I saw Joe Mako’s submission to Cole Nussbaumer’s dataviz challenge last December. Joe made this contest-winning chart. But in Tableau! The amazing but expensive software! Could I ever create one in Excel?! Yes! Luckily I’d…

Continue reading →

Dataviz Challenge #5: Can You Make a Diverging Stacked Bar Chart?

Dataviz Challenge #5: Can You Make a Diverging Stacked Bar Chart?

Last week I shared strategies for improving any chart’s colors. One of the examples was a diverging stacked bar chart: I love stacked bar charts because they’re pretty versatile, and because they’re a great chart for lots of evaluation and survey data. In my example,…

Continue reading →

Page 1 of 4 1 2 3 4

Related Links:

Togel178

Pedetogel

Sabatoto

Togel279

Togel158

Colok178

Novaslot88

Lain-Lain

Partner Links